Cone of Uncertainty
The Cone of Uncertainty is a project management concept.
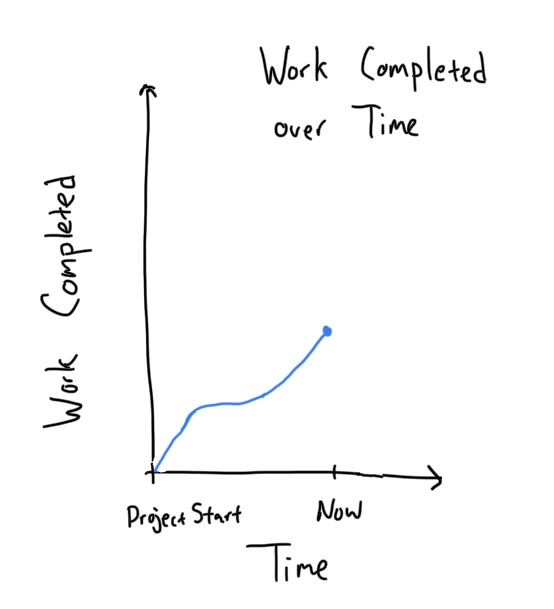
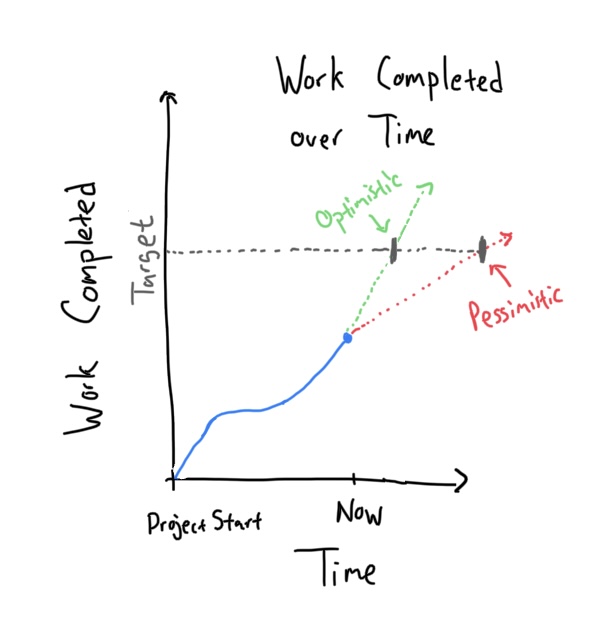
First, we plot the progress of project over time with time on the X-axis and amount of work completed on the Y-axis
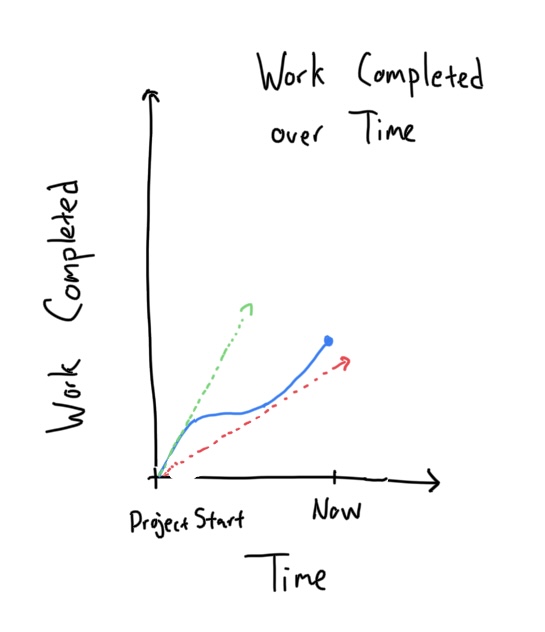
Then, we can identify the fastest possible pace and the slowest possible pace for the project by drawing lines that contain our progress line. These correspond to the worst and best case for the average performance over time.
If we draw lines for the worst and best case performance at the end of our progress line, we draw the “cone of uncertainty”: a zone representing the possible status for our project in the future.
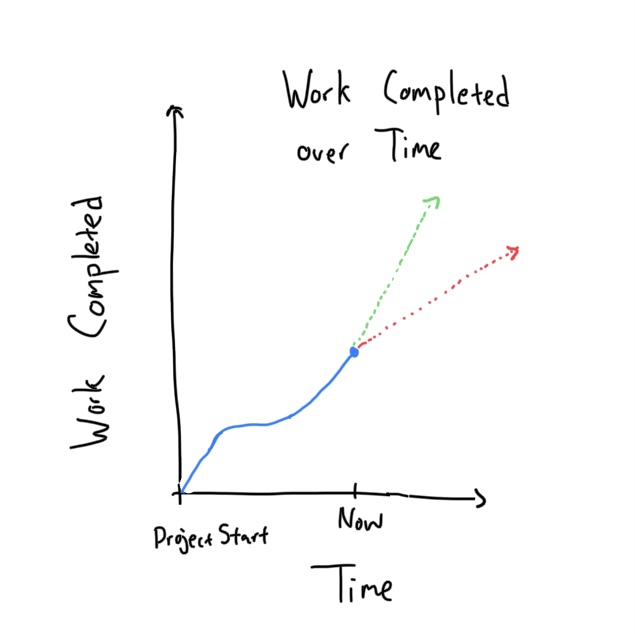
We can now use this “cone of uncertainty” to answer questions about our project.
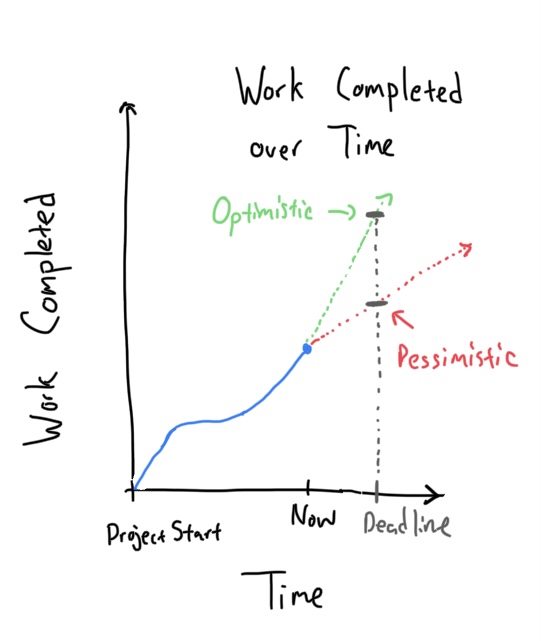
If we want to ask “when will the project be done,” we can draw a horizontal line across the chart for some definition of done and see where it intersects the cone.
Alternatively, we can ask “how much work will be complete by a given day” by drawing a vertical line at the given day and seeing where that line intersects the cone.